How to Analyze Crawl Stats & Budget in Google Search Console
Learn to analyze crawl health scores, visualize request breakdowns, and optimize crawl budget.
While Google Search Console provides raw data on how Googlebot interacts with your site, interpreting this data for SEO strategy can be challenging. The Advanced GSC Visualizer transforms the standard "Crawl Stats" report into an actionable Analytics Dashboard.
This guide explains how to access the enhanced report and use its three main tabs to optimize your site's technical health and crawl budget.
Step 1: Access the Enhanced Report
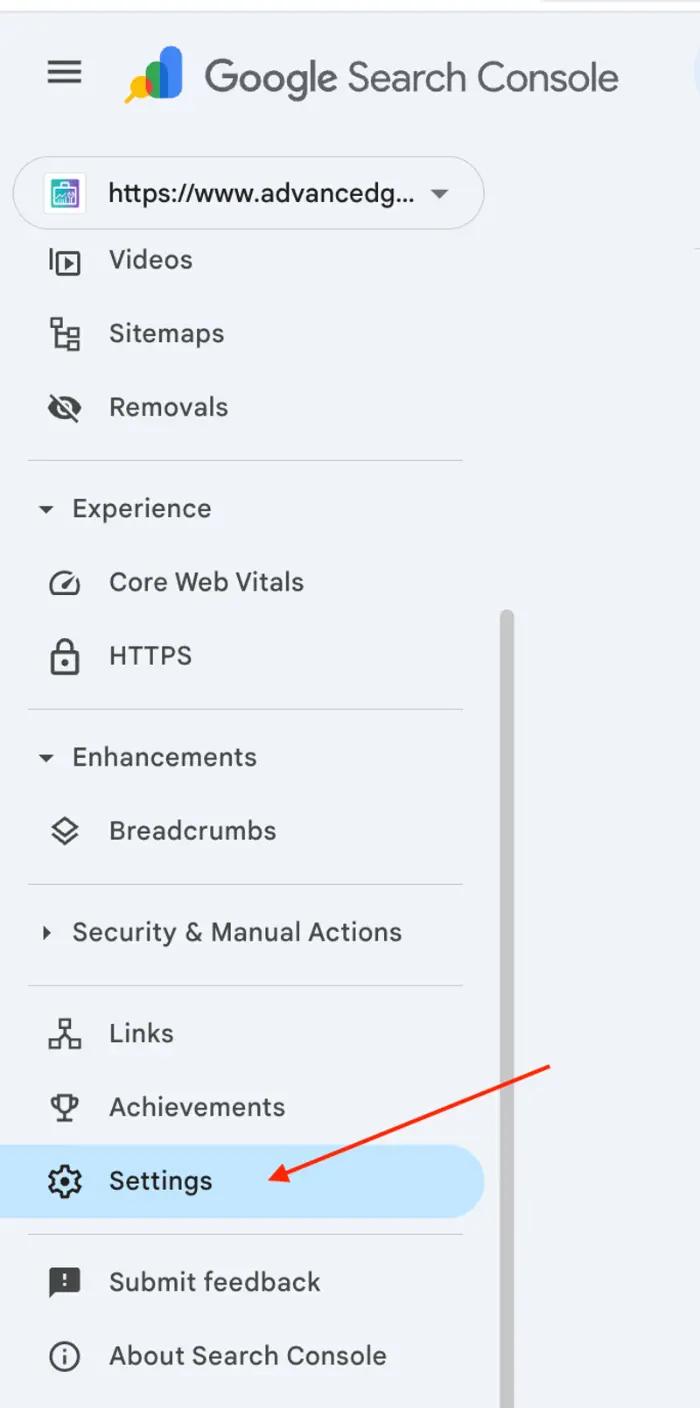
- Open Settings: Navigate to your Google Search Console property and click on Settings in the left-hand menu.
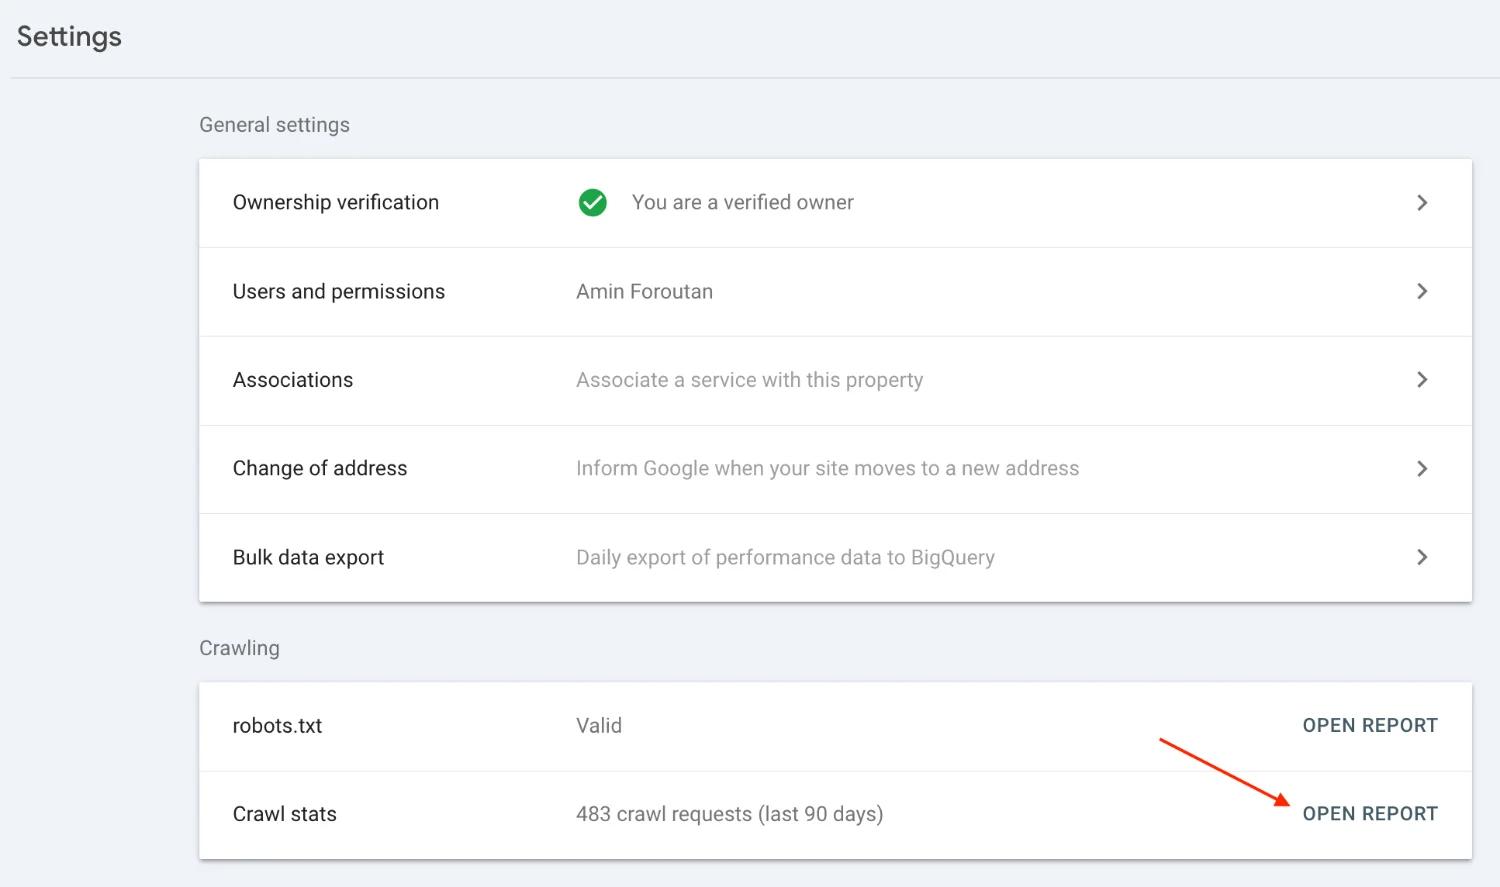
Open Crawl Stats: Scroll down to the "Crawling" section and click Open Report next to Crawl stats.
Refresh (Crucial Step): Once you land on the standard Google Crawl Stats page, refresh the browser.
The extension will overlay the new Crawl Stats Analytics dashboard on top of the standard view.
Tab 1: Overview & Crawl Health
The Overview tab provides an immediate snapshot of your website's technical reliability. The centerpiece of this view is the Crawl Health Score, a calculated metric that helps you gauge reliability at a glance.
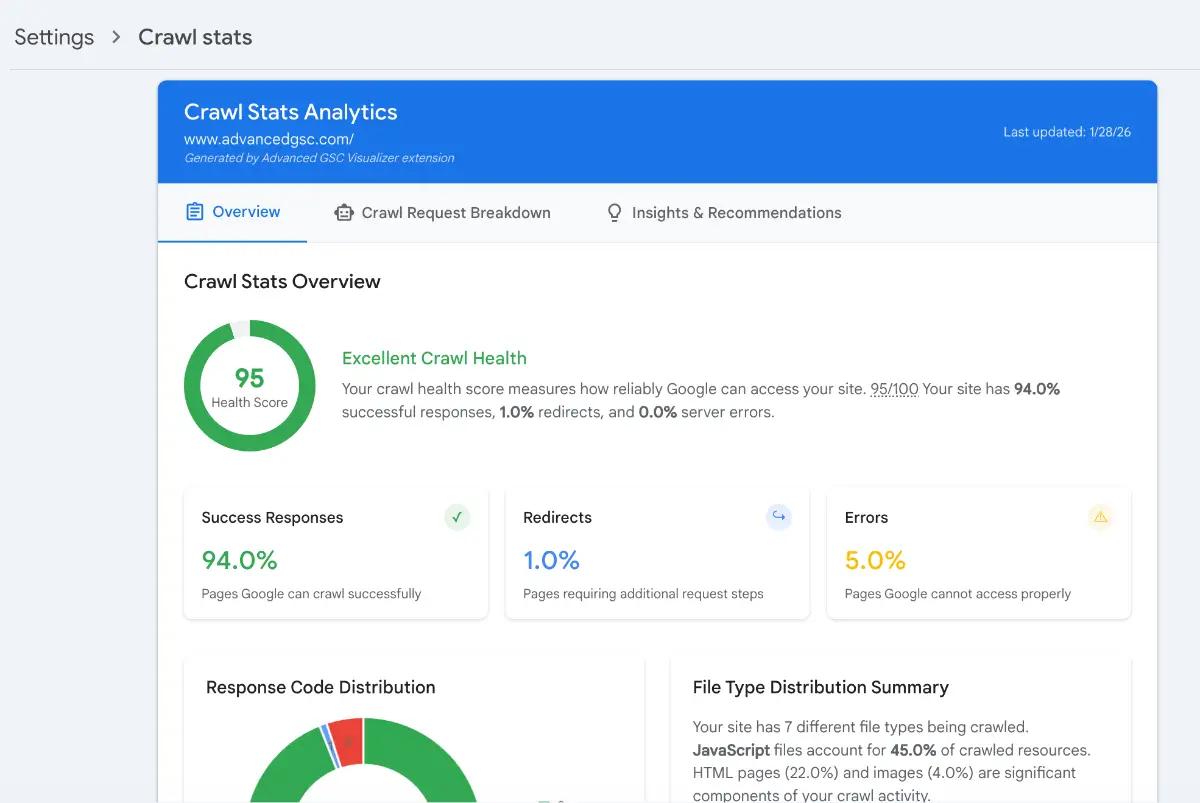
Understanding the Crawl Health Score
This score starts at 100 and applies penalties based on response errors. A higher score indicates a more reliable environment for search crawlers.
Calculation Logic:
- Base Score: 100 points
- Server Errors (5xx): Percentage × 3 (Subtracted)
- Client Errors (4xx): Percentage × 1 (Subtracted)
- Redirects (3xx): Percentage × 0.3 (Subtracted)
Example: If you have 0% server errors, 1.5% client errors, and 5% redirects, the score is calculated as 100 - 0 - 1.5 - 1.5 = 97.
Visual Distributions
This tab also provides visual breakdowns of:
- Success Responses (200 OK)
- Redirect Chains
- Error Rates
- Response Code Distribution
Tab 2: Crawl Request Breakdown
Gain granular visibility into exactly what Googlebot is requesting. This tab replaces raw lists with interactive data visualizations.
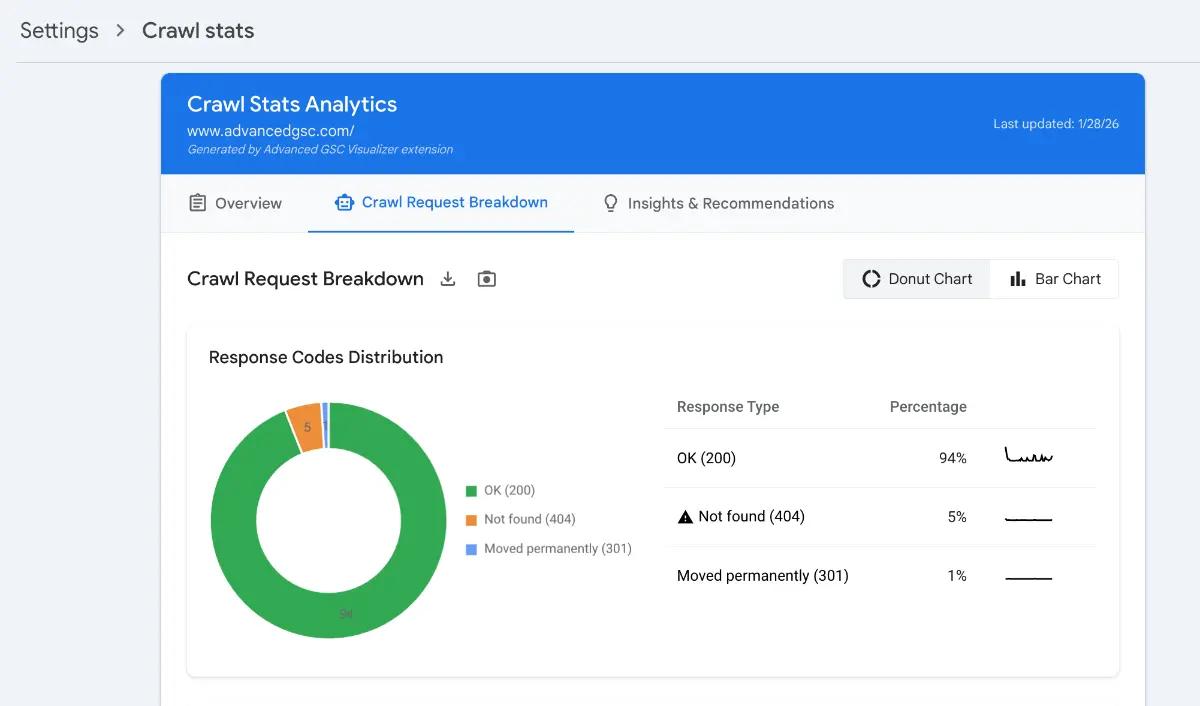
- Visual Charts: View your request data formatted as clear Donut Charts or Bar Charts.
- Data Export: Easily export the breakdown data as a CSV file for external reporting or client presentations.
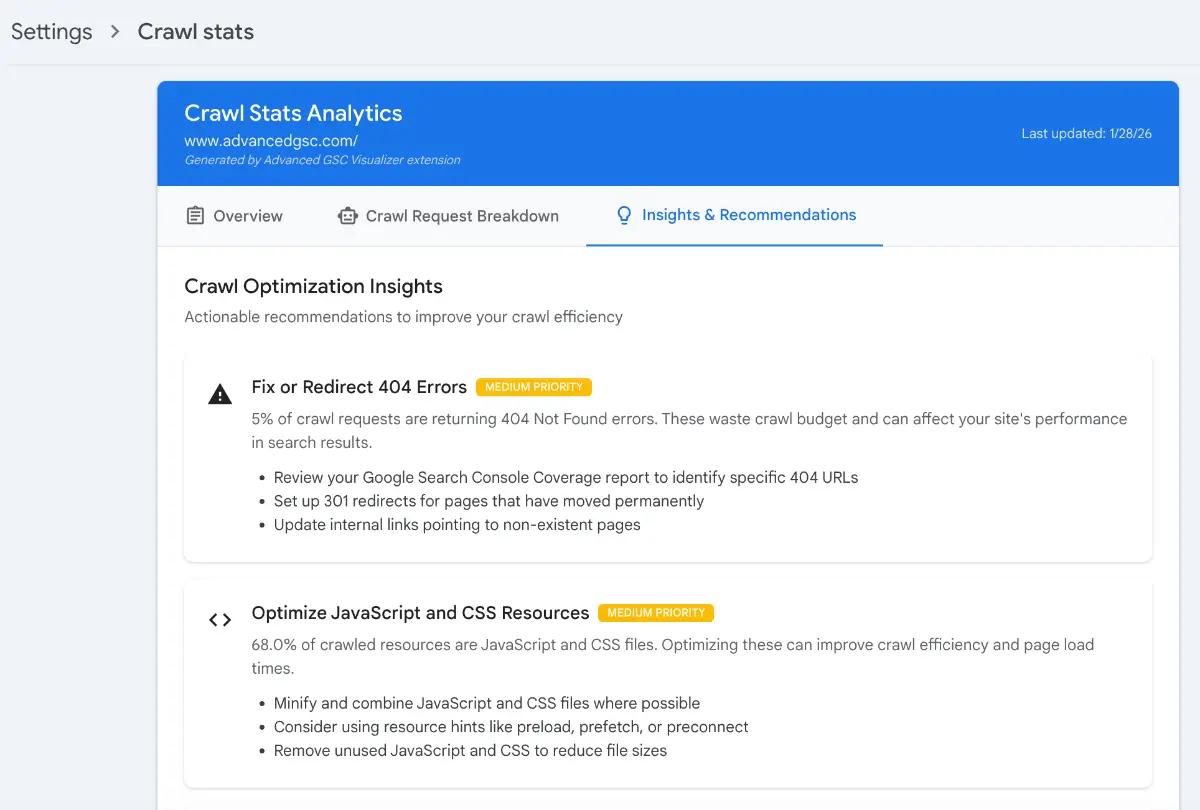
Tab 3: Insights & Recommendations
The final tab focuses on actionable strategy—specifically Crawl Budget Optimization. This section analyzes your data to provide specific recommendations on how to improve crawl efficiency.
Crawl Budget Efficiency Score
This metric evaluates how effectively Googlebot spends its time on your site, rewarding actual content retrieval over redirects or errors.
Calculation Logic:
- Success Rate Reward: Success % × 0.5 (Points Added)
- HTML Content Reward: HTML % × 0.5 (Points Added)
- Redirect Penalty: Redirect % × 0.5 (Points Subtracted)
Example:
- Success rate (95.0%) contributes 47.5 points
- HTML content (50.0%) contributes 25.0 points
- Redirect percentage (5.0%) subtracts 2.5 points
- Total Efficiency Score: 70.0
Actionable Advice
Based on these metrics, the extension provides a checklist of prioritized actions to help you reduce waste and ensure Google prioritizes your most important content.