How to Visualize Indexed HTML Code
Learn how to upgrade the GSC Inspection Tool to render raw indexed HTML code as a visible web page for better analysis.
The Google Search Console Inspect Tool is essential for checking your pages, providing access to the full indexed HTML code. However, analyzing raw code is often inefficient for spotting visual discrepancies, broken layouts, or missing elements.
The Advanced GSC Visualizer upgrades this workflow by rendering that indexed code visually. This allows you to analyze exactly what Google sees in a browser-like format, rather than digging through thousands of lines of code.
Follow these steps to inspect the visual output of Google's indexed data.
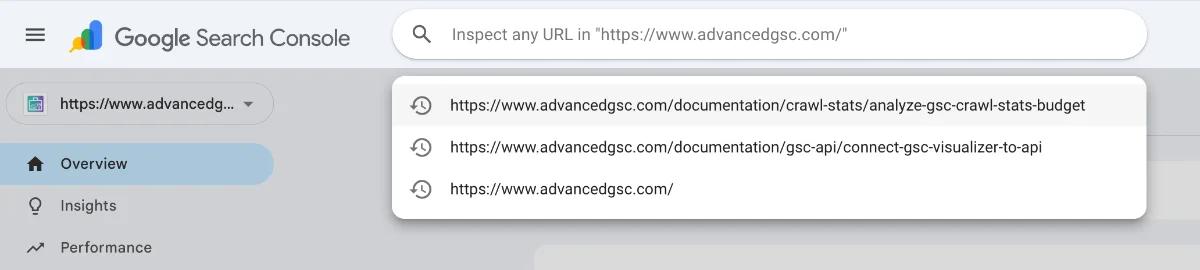
Step 1: Inspect a URL
Use the standard search bar at the top of Google Search Console (the URL Inspection Tool). Enter any URL from your property and press Enter to inspect it.
Step 2: Refresh the Page
Once the inspection results load, refresh your browser page. This action initializes the extension and overlays the advanced tools onto the standard GSC interface.
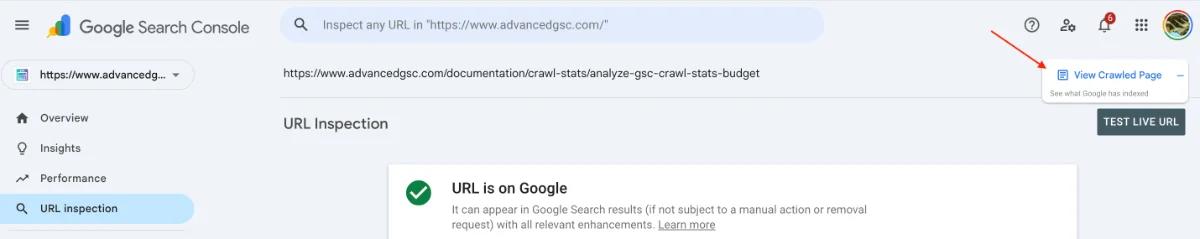
Step 3: Launch the Viewer
Look for a new floating button in the top-right corner of the screen labeled View Crawled Page. Click this button to initiate the visualizer.
Step 4: Grant Clipboard Permissions (First Time Only)
If this is your first time using the feature, a popup will appear requesting permission to copy text to your clipboard.
- Why is this needed? The extension needs to copy the raw HTML code indexed by Google to render it visually in the viewer.
- Safety Note: This process is safe and local to your browser session.
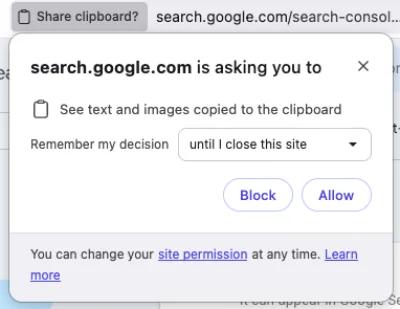
Click Allow to proceed. You may select the option to Remember my decision forever to skip this prompt in the future.
Step 5: Analyze the Visual Render
A popup window resembling a browser interface will appear. This window renders the page exactly as constructed from the HTML code Google indexed.
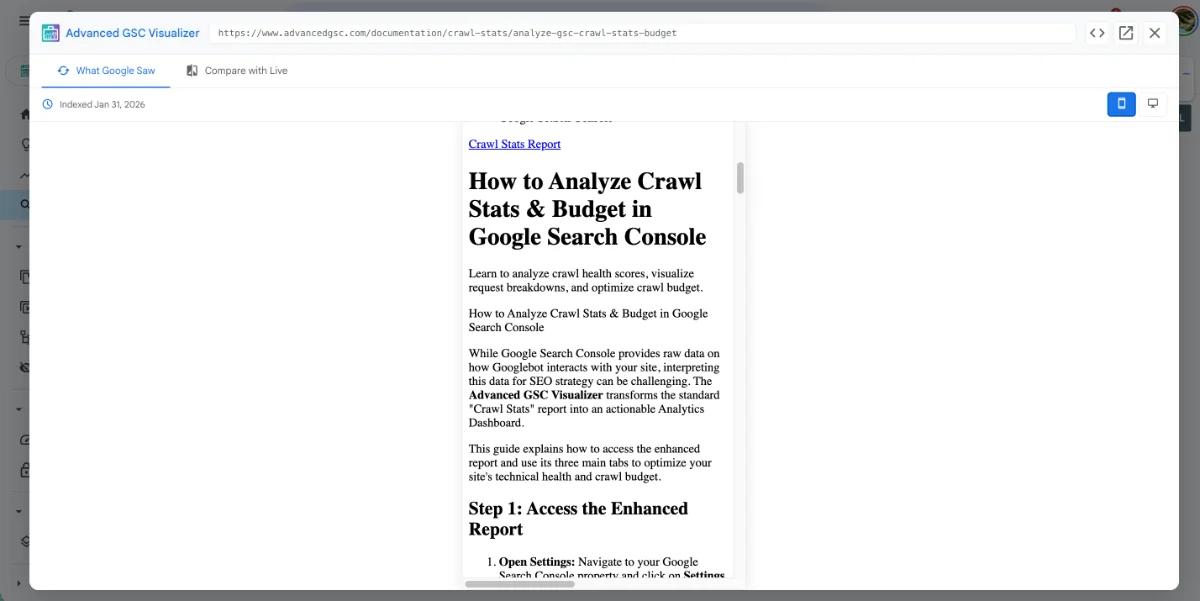
You can now visually inspect the layout, content visibility, and design elements to ensure they match your live site and expectations.