How to View Google Algorithm Updates in Search Console
Learn how to overlay official Google algorithm updates directly onto your GSC performance charts to analyze traffic impacts.
Tracking how algorithm changes affect your organic traffic is often a tedious process of cross-referencing external update timelines with your Google Search Console data. The Advanced GSC Visualizer streamlines this workflow by rendering confirmed Google updates directly on top of your performance chart.
Follow these steps to overlay algorithm updates onto your data.
Step 1: Activate the Advanced Chart
Before you can toggle the updates, you need to launch the interactive charting tool.
- Prerequisite: Please refer to our guide on How to Activate the Advanced Visualization Chart to get started.
Step 2: Open the More Menu
Once the advanced chart is actively displaying your daily performance data, navigate to the toolbar at the top of the chart area. Click on the More button to reveal the extended settings dropdown.
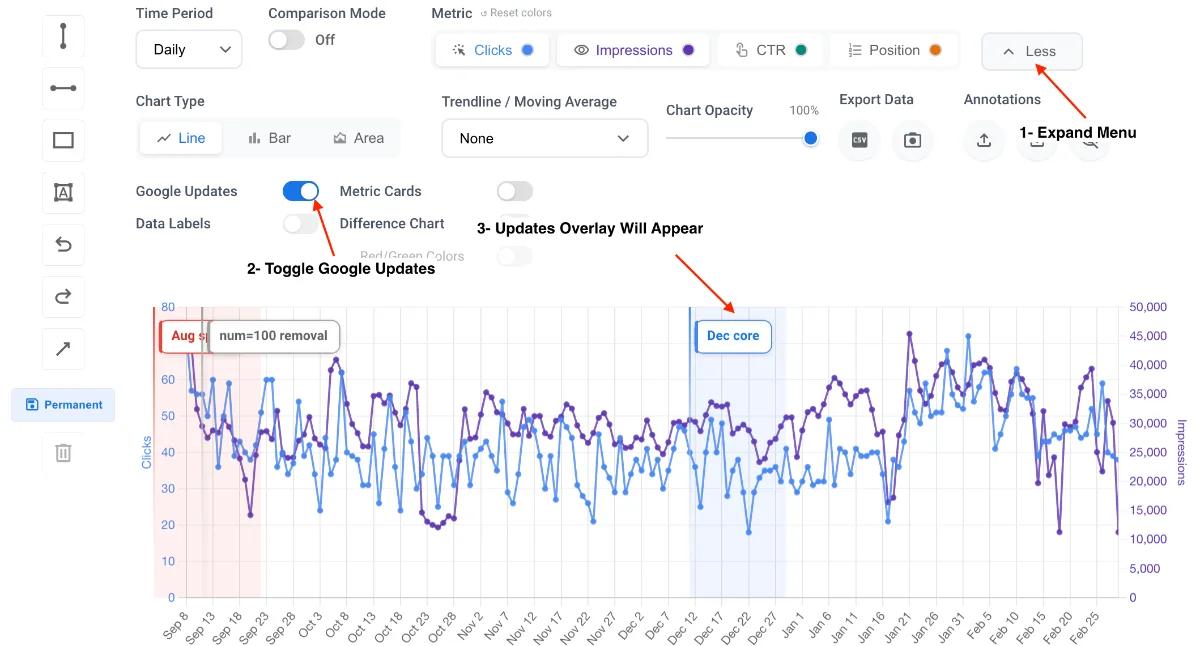
Step 3: Toggle Google Updates
Inside the dropdown menu, locate the setting labeled Google Updates.
Click the toggle switch to activate it. The chart will immediately refresh to include the update data.
Visualizing the Impact
Once activated, the chart will display vertical indicators corresponding to the dates of official Google algorithm rollouts (such as Core Updates, Spam Updates, or Helpful Content Updates).
How to Analyze the Data
- Duration Highlights: The tool displays the full length of the rollout period, not just the start date. This allows you to observe traffic volatility across the entire deployment window.
- Correlating Volatility: By viewing the update timeline directly against your Clicks and Impressions, you can instantly see if a sudden traffic drop or spike aligns with a specific algorithm change.
- Combine with Annotations: For client reporting, use the visualizer's drawing tools to draw arrows or boxes specifically highlighting the traffic shift caused by the Google Update.